Graph analysis... ahem...
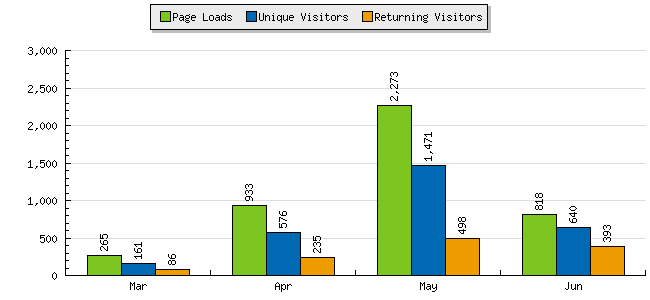
The hits for April and May were greatly affected by the elections (or post-elections). During the few days before polling day, the numbers can go beyond 100. The highest number of hits in one day was in the start of May, reaching about 200+ views. That's when Mr Wang quoted me in his blog, Mr Wang Bakes Good Karma (I can't find that particular entry anymore... I guess he has deleted it). To be frank, it was rather scary; for a moment, I thought ISD has tuned into my blog...
The hits for June are probably more normal, and future monthly hits should remain at around this level unless some unforeseen spotlight (or worse, the Sauron Eye spotlight) is aimed at me. I do expect future monthly hits to be slightly above June's, mainly because there were a few breaks in June.
Anyway, extrapolating into the future, when I was looking at this graph at the start of June (i.e. I have the statistics for March to May), a thought dashed through my mind: are the hits adhering to an exponential behaviour? This thought kinda freaked me out... I can't imagine the daily hits of 200+ for that to happen, and the even higher hits in following months. However, disregarding May's abnormal data and taking June's statistics into account, it can be said that the hits are following somewhat a logarithmic growth, which, logically, should be expected.
Why do I get the feeling that I'm reading too much into my data? I mean, I was thinking if a Gaussian curve will fit the data better or a Maxwell-Boltzmann curve provides better predictions.


No comments:
Post a Comment